Total internal reflection ellipsometry (TIRE)
| ||||||||||
|
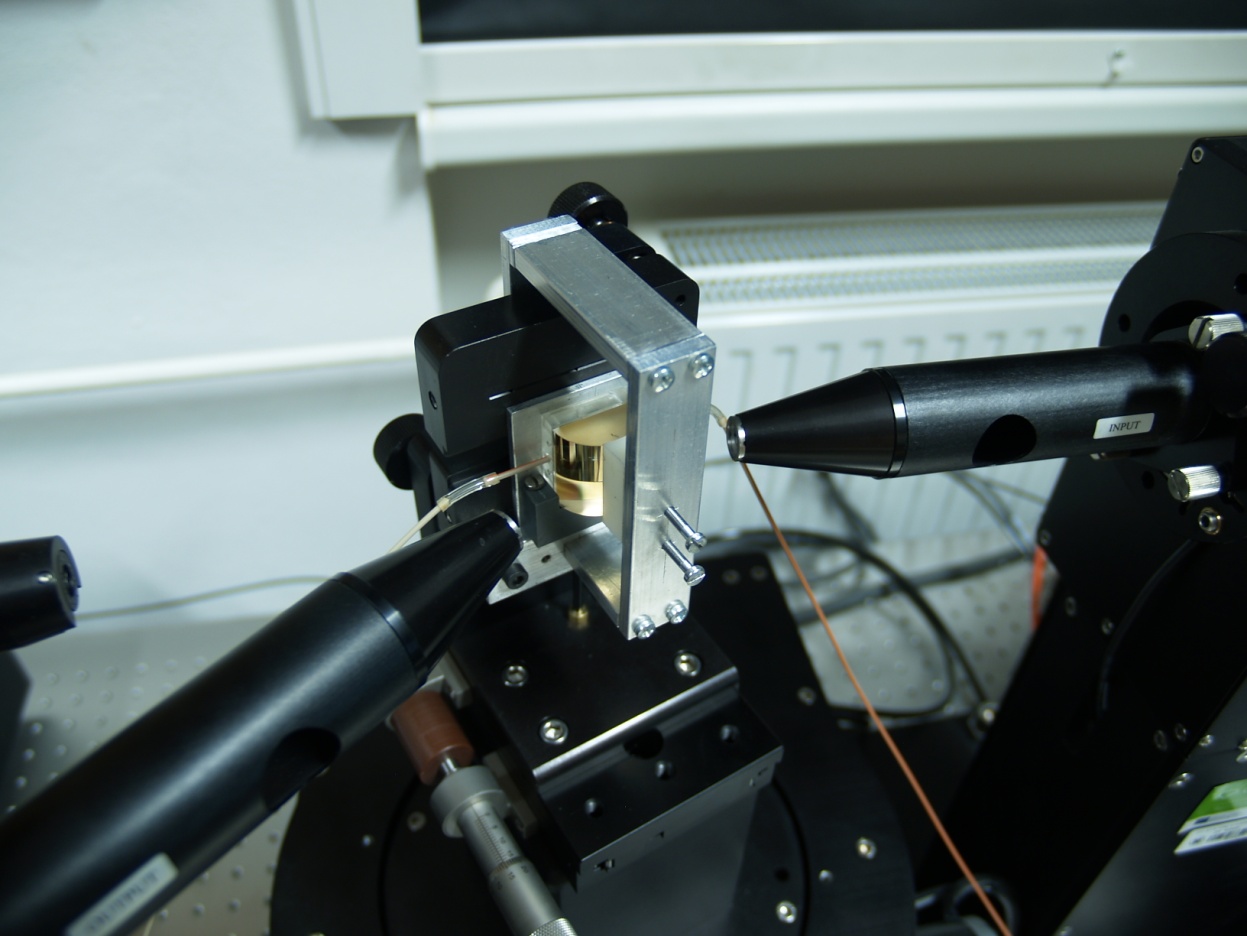
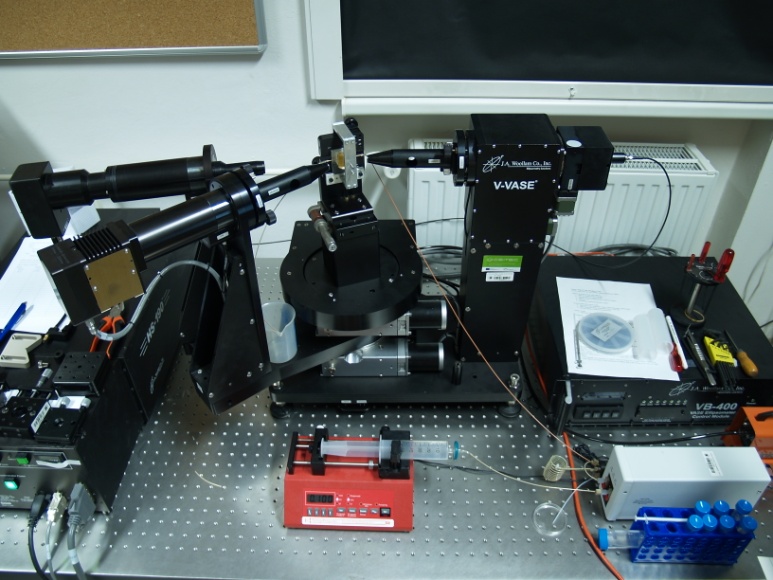
Spectroscopic ellipsometry (SE) with enhancement by the surface plasmon resonance (SPR) effect becomes a powerful tool for monitoring the adsorption of biomolecules on thin (metal) films as well as for analyzing the thin films themselves. In combination, these two techniques can safely detect changes of refractive index of the order 10-6 w.r.t surrounding media.
focus points:
|
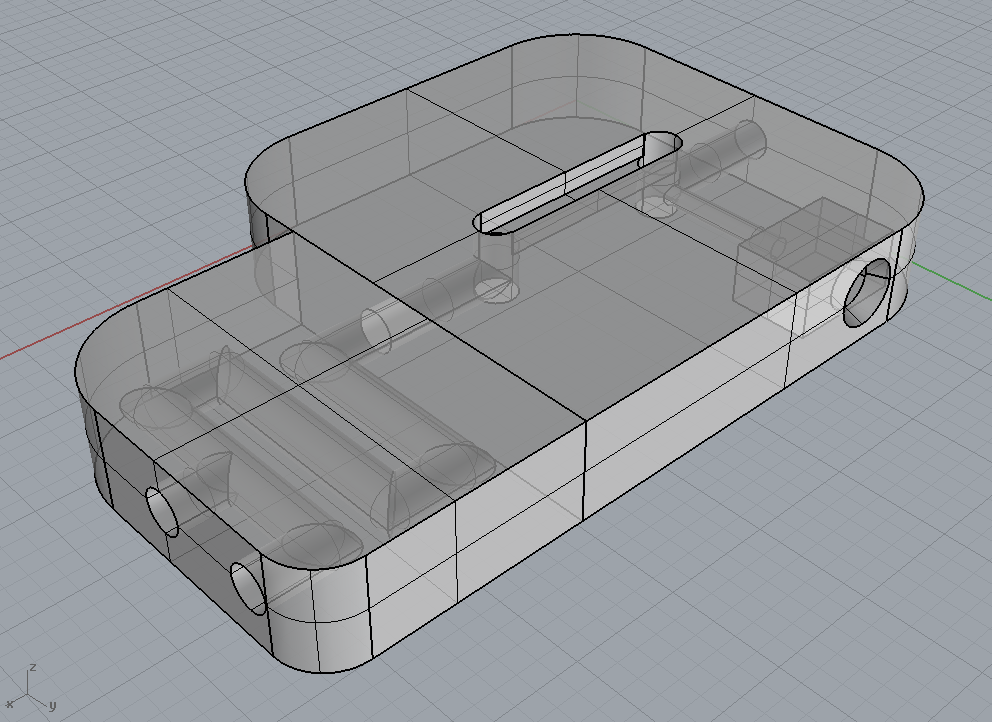 Production model for our home made TIRE cell: a two-way mixing part (left block) followed by a TIRE channel (right block); note the temperature gauge inlet (right-most opening). |
|||||||||
| ||||||||||
| ||||||||||
case studies: | ||||||||||
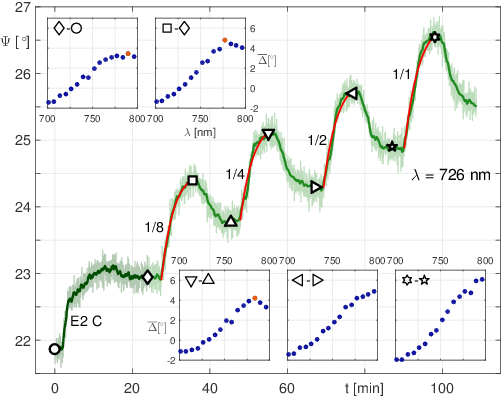 Kinetic study of Rtt103-CID binding over CTD peptide using maximum sensitivity wavelength in Psi. First part (dark) of the curve maps immobilization of CTD, the four Rtt103-CID binding steps follow (light) with fits of the association phase depicted (orange). At marked instants, full spectra were taken and the resulting difference spectra in Del are given in the insets together with highlighting the reached maxima. [2] 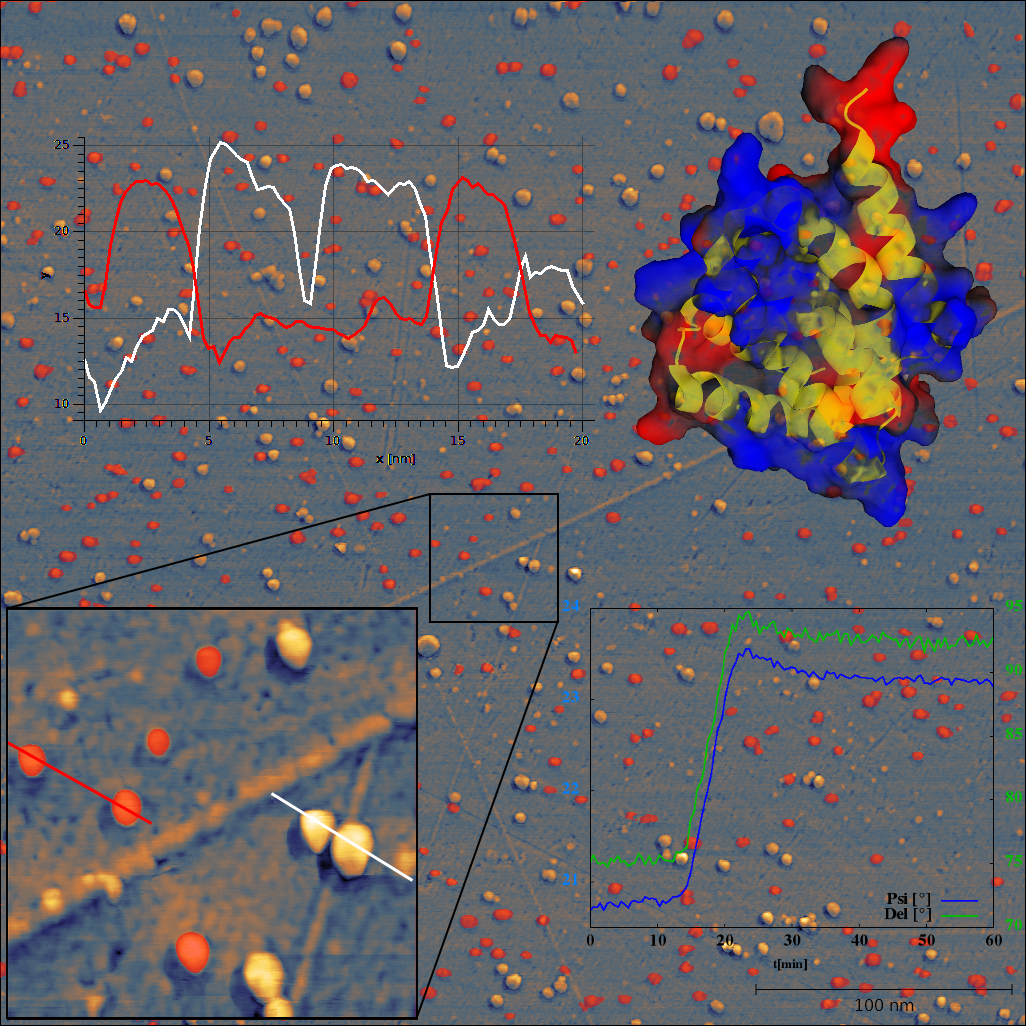 AFM phase-contrast image of Rtt103 protein CID immobilised through TIRE system over Au/SiO2 substrate. Using the topographic scan, the candidates for Rtt103-CID are masked red (selected to comply with dimensions deduced from rcsb.org 2KM4 structure). (2016)
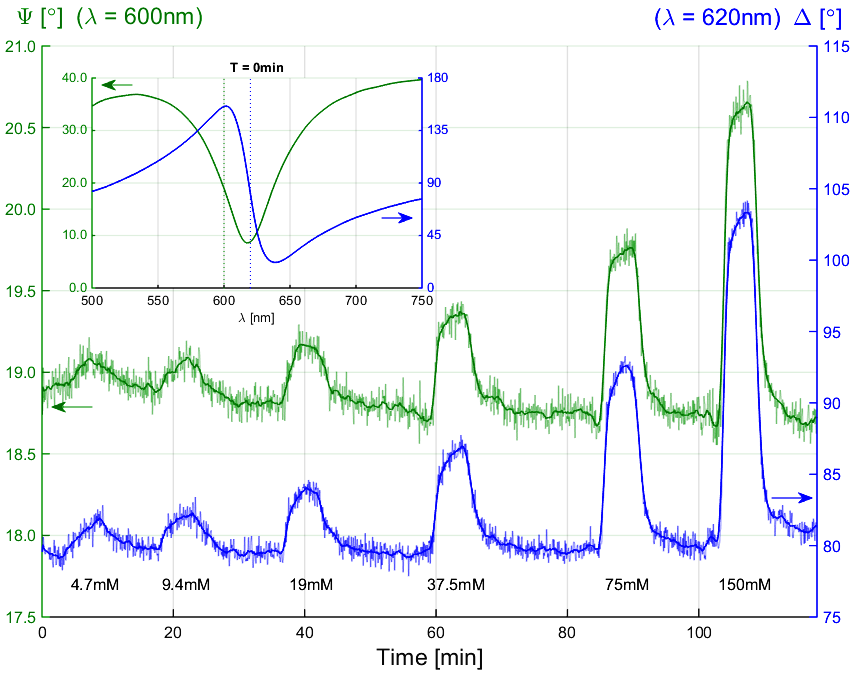 Dynamic scan, 50nm Au over BK7 in water ambient, AOI=75,5 deg: the six peaks correspond to buffer effect after marked concentrations NaCl solution injection. The inset shows spectrum of ellipsometric angles before injections started; the wavelengths of highest sensitivity, used in the main figure, are noted by dotted lines.(2014) |
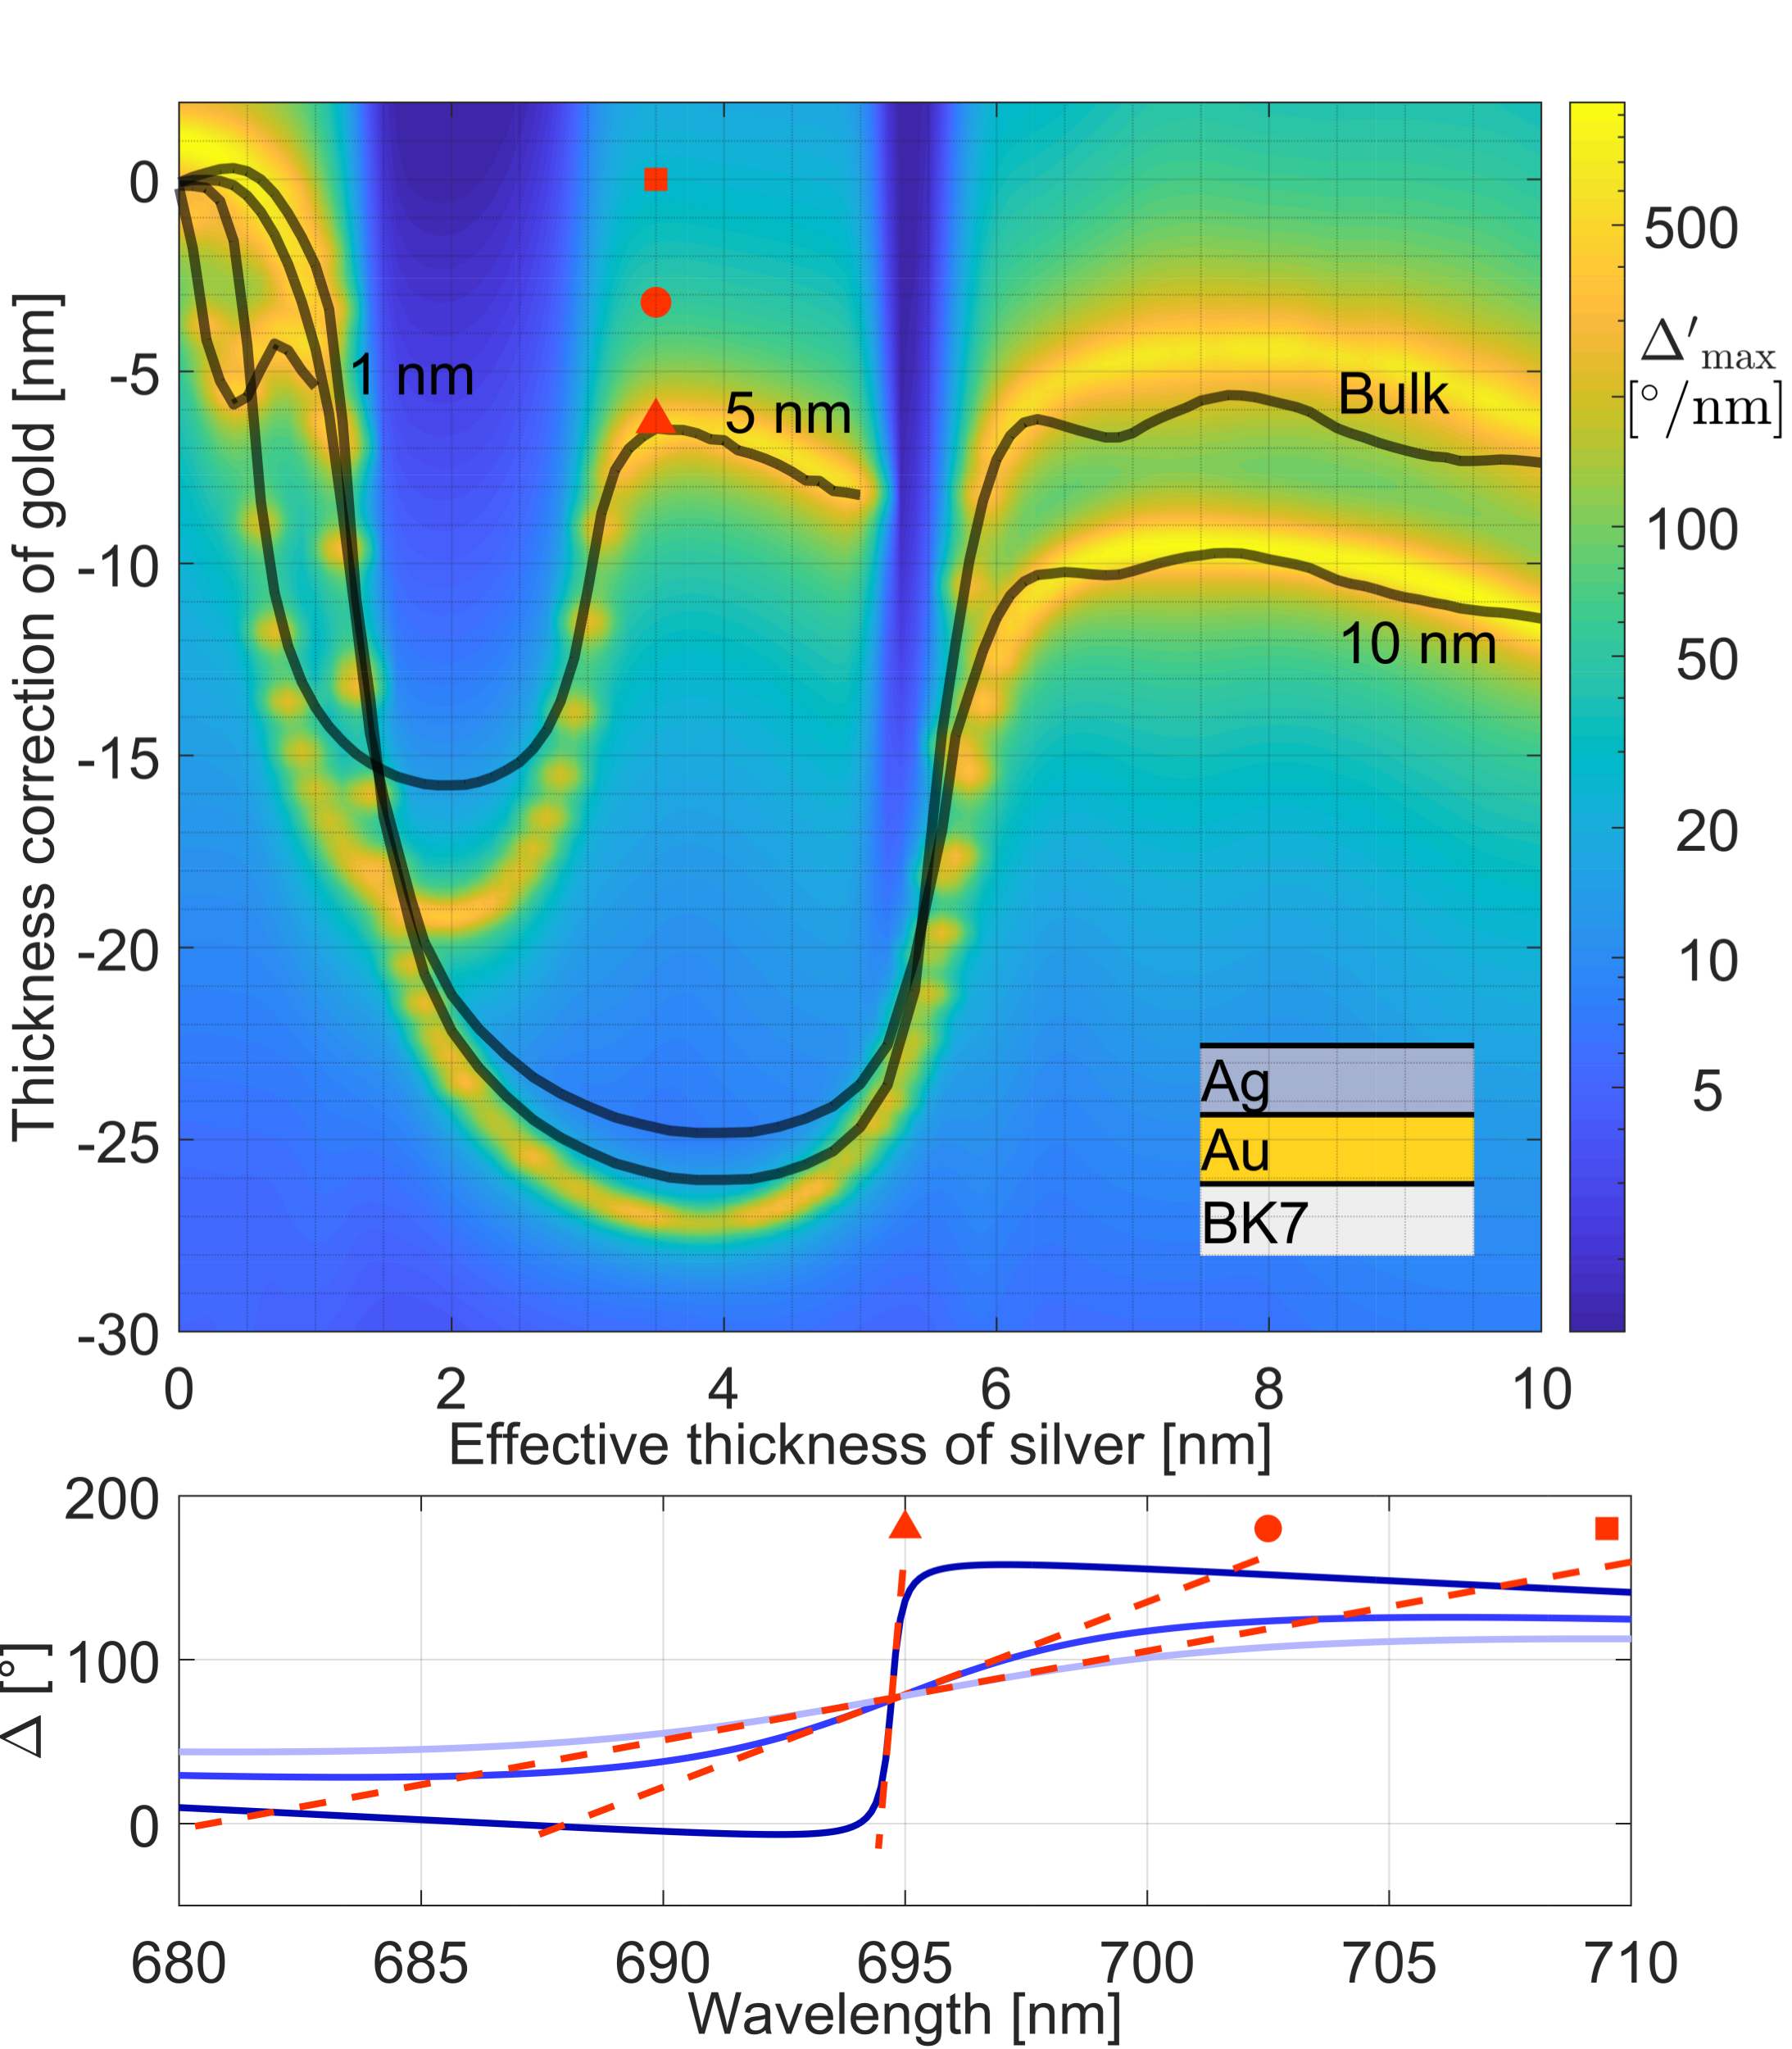 Tuning of bare Au thickness for optimal SPR performance afer coating with with Ag nanoparticles of the given thickness, AOI$=70^\circ$ in water ambient using Bruggeman effective medium. Dependence of coverage of the substrate with nanoparticles of different size (color maps) including nanoscale correction of optical constants is given together with its analytical approximation (solid lines). Resulitng sensitivity is shown in the bottom panel. [3] 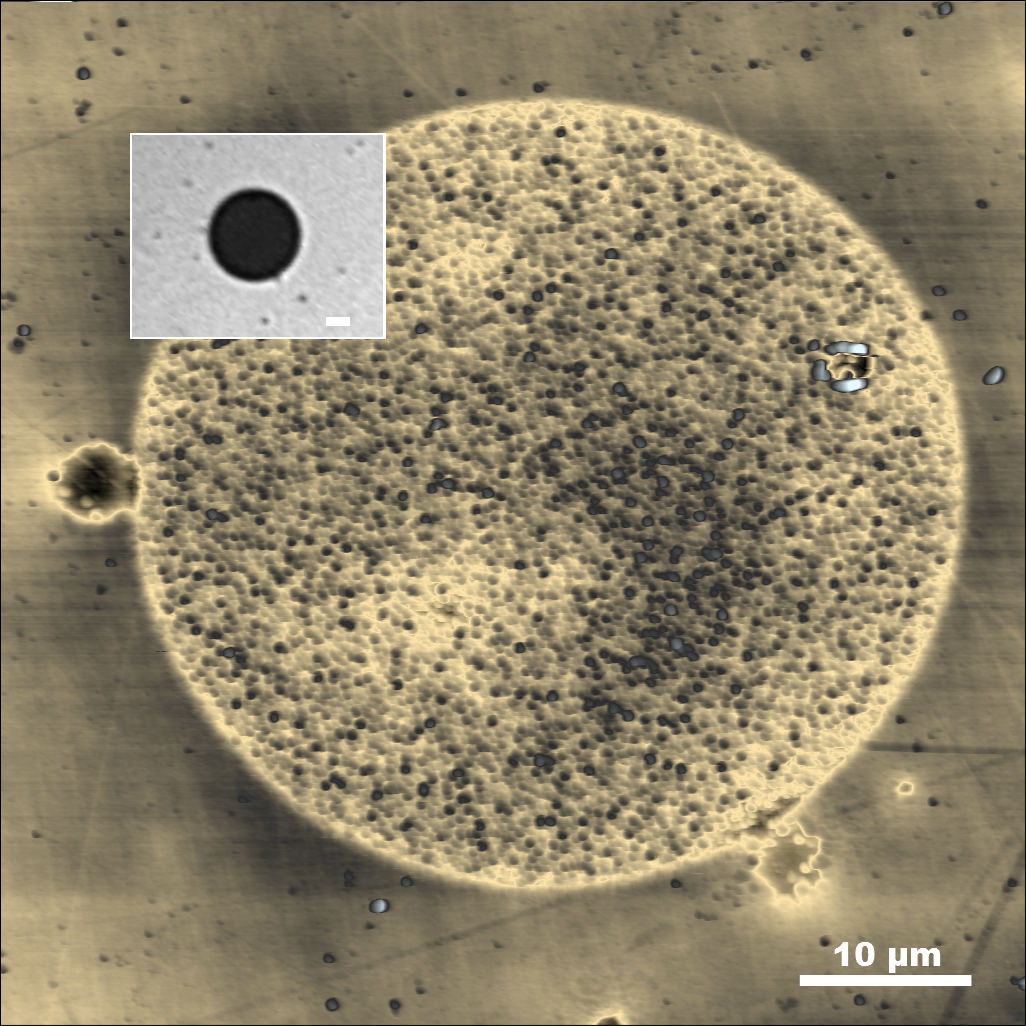 AFM image of FIB masked BK7/Au substrate. Gold layer was removed within the central circle in view of SPR tayloring. The FIB area shows substantial roughness. The inset shows optical image of the area, scale bars are 10 um. (2018) 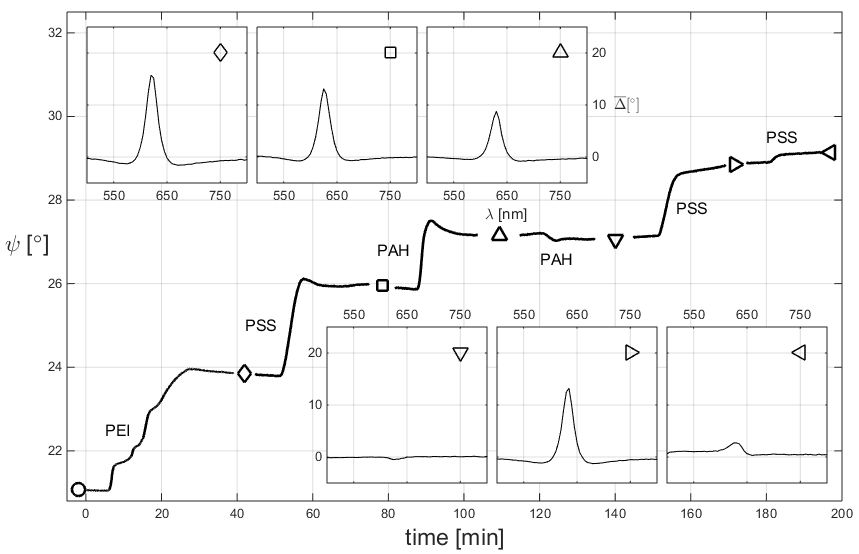 TIRE monitoring of the PEI-PSS-PAH polyelectrolyte multilayer formation. The insets show difference spectra in Delta. (2015) |
|||||||||

